 Buy Crypto
- Markets
 Futures
- Spot
- Copy Trade
- Earn
- More
Historical B/S Indicators for Candlestick Charts


WEEX just got smarter! Review past trades and refine your strategies with our brand-new feature: Historical B/S (Buy/Sell) markers for candlestick charts! Now, you can view your past trades right on the chart, helping you make sharper decisions and trade more efficiently.
Highlights
- Trade records at a glance
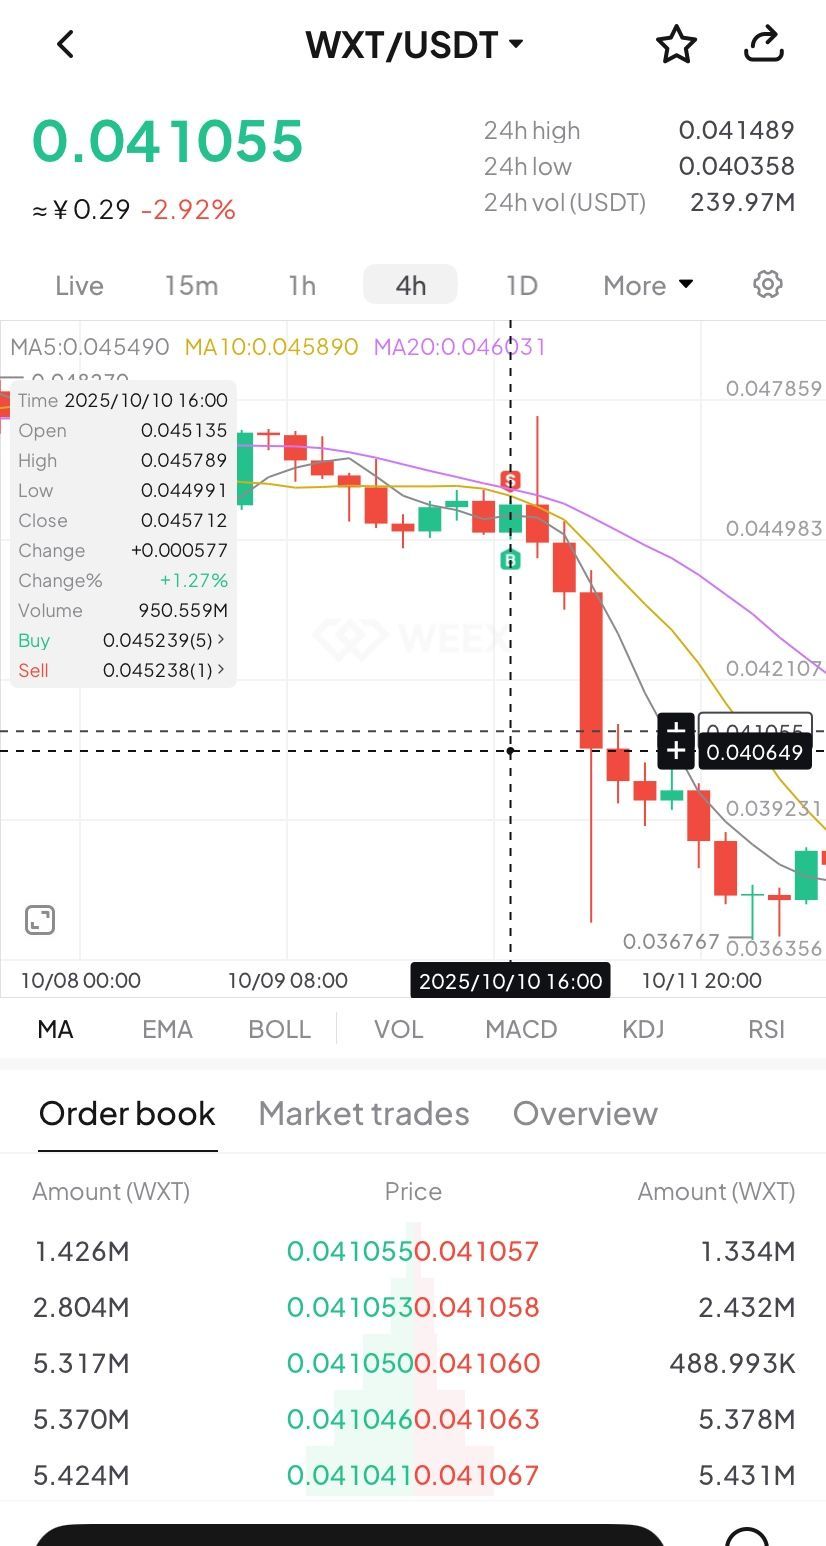
- Your Buy (B) and Sell (S) points are automatically marked on the chart.
- Each marker shows your precise trade time and price, helping you review past orders at a glance.
- Comprehensive coverage
- Spot trading: Full support for marking trades across all spot pairs.
- Futures trading: Clearly shows open and close points, distinguishing between long and short positions.
- Rich interactions
- Tap any marker (B or S) to view detailed trade information, such as:
- Trade time: Review exact trade times and corresponding market conditions.
- Execution price: Displays the average filled price of historical trades.
- Trade count: Quickly check the number of trades in a certain period.
- Markers update dynamically as you zoom and drag the candlestick. Seamlessly review up to 100 executed trades from the last 90 days.
- Universal access
- Available on both iOS and Android: Access your trade history anytime, on any mobile device.
- Full currency coverage: Supports all pairs in your portfolio, across both spot and futures markets.
How to Use?
- Open the WEEX app and go to any pair's chart page.
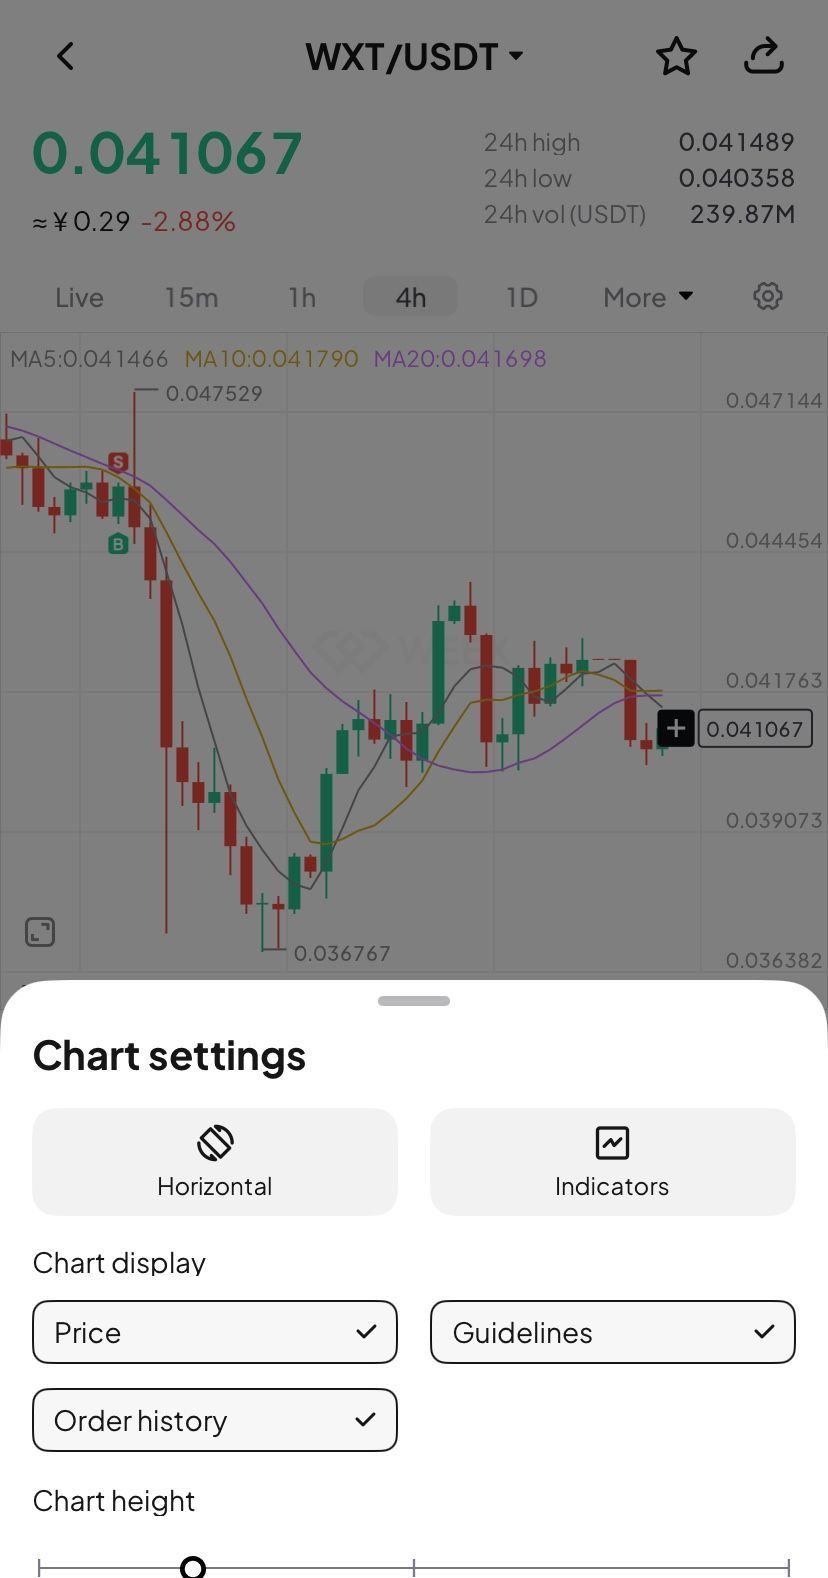
- Tap the candlestick chart and enable the "Order history" feature in the chart settings (enabled by default.)
- If trades exist for that pair, B and S markers will instantly show up on the chart.
- Tap any marker to check the full details of that transaction.
Where to use it
- Review strategies: Quickly review your buy and sell points combined with market trends to refine your strategy.
- Analyze PnL: Easily pinpoint profitable or losing trades to learn from your past performance.
Understand trends: Combine your trade history with the candlestick chart data for deeper market and behavioral analysis.
Feature preview
- On/off toggle: Use the "Settings" icon to switch the "Order History" feature on or off (enabled by default).
- B (Buy) marker: Green marker showing your exact buy action.
- S (Sell) marker: Red marker identifying every sell transaction.
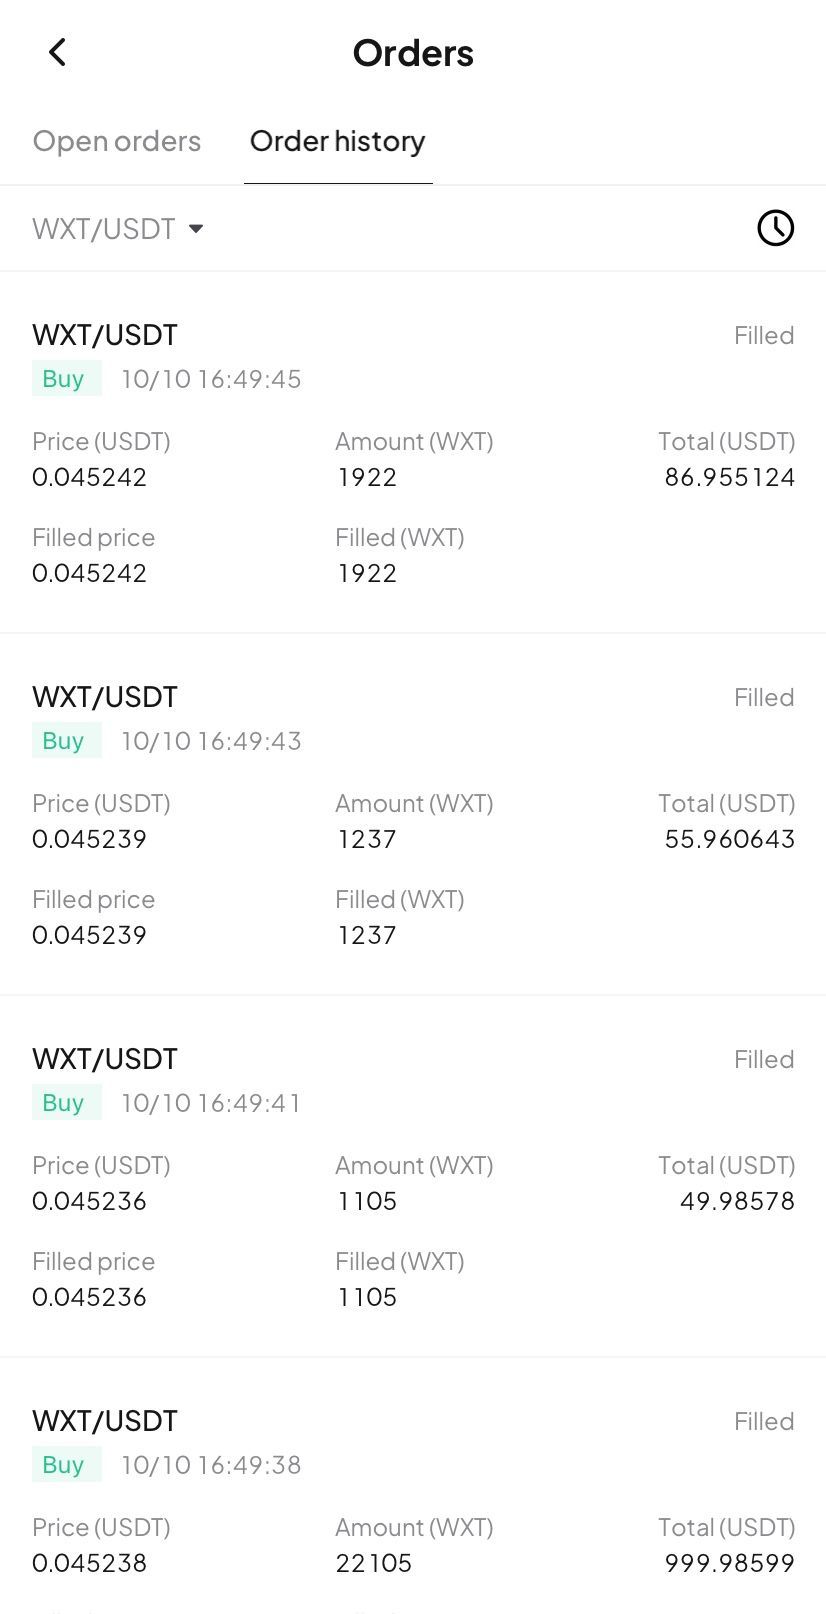
- Details pop-up: Tapping the marker brings up a card with key data (time, price, and count).
- Full breakdown: Tap the details card to open the "Order History" page and view your trading record.
Try now
Update your WEEX app to the latest version to experience our new Buy/Sell markers! Gain clarity and transparency in your trades, empowering smarter investment decision!
You may also like

Tom Lee's Ethereum Thesis: Why the Man Who Called the Last Cycle Is Doubling Down on Bitmine
Tom Lee is emerging as one of Ethereum’s most influential supporters. From Fundstrat to Bitmine, his Ethereum thesis combines staking yield, treasury accumulation, and long-term network value. Here is why “Tom Lee Ethereum” has become one of crypto’s most watched narratives.

Naval personally takes the stage: The historic collision between ordinary people and venture capital

a16z Crypto: 9 Charts to Understand the Evolution Trends of Stablecoins

Refutation of Yang Haipo's "The End of Cryptocurrency"

Can a hairdryer earn $34,000? Interpreting the reflexivity paradox of prediction markets

6MV Founder: In 2026, the "landmark turning point" for crypto investment has arrived

Abraxas Capital Mints $2.89 Billion USDT: Liquidity Boost or Just More Stablecoin Arbitrage?
Abraxas Capital just received $2.89 billion in freshly minted USDT from Tether. Is this a bullish liquidity injection for crypto markets, or is it business as usual for a stablecoin arbitrage giant? We analyze the data and the likely impact on Bitcoin, altcoins, and DeFi.
A VC from the Crypto world said AI is too crazy, and they are very conservative
The Evolutionary History of Contract Algorithms: A Decade of Perpetual Contracts, the Curtain Has Yet to Fall

Kicked out by PayPal, Musk aims to make a comeback in the cryptocurrency market

Solana ETF News: What Is a Solana ETF and Why Is Goldman Sachs Betting $108 Million on SOL?
Solana ETF news today shows Goldman Sachs disclosed a $108M position while total SOL ETF inflows reached $1.45B. Analysts now expect up to $6B in institutional demand as Solana trades 71% below its all-time high.

Bitcoin ETF News Today: $2.1B Inflows Signal Strong Institutional Demand for BTC
Bitcoin ETFs news recorded $2.1B inflows over 8 consecutive days, marking one of the strongest recent accumulation streaks. Here’s what the latest Bitcoin ETF news means for BTC price and whether the $80K breakout level is next.
Michael Saylor: Winter is Over – Is He Right? 5 Key Data Points (2026)
Michael Saylor tweeted yesterday “Winter‘s Over.” It is short. It is bold. And it has the crypto world talking.
But is he right? Or is this just another CEO pumping his bags?
Let us look at the data. Let us be neutral. Let us see if the ice has really melted.

WEEX Bubbles App Now Live Visualizes the Crypto Market at a Glance
WEEX Bubbles is a standalone app designed to help users quickly understand complex crypto market movements through an intuitive bubble visualization.

Polygon co-founder Sandeep: Writing after the chain bridge chain explosion

Major Upgrade on Web: 10+ Advanced Chart Styles for Deeper Market Insights
To deliver more powerful and professional analysis tools, WEEX has rolled out a major upgrade to its web trading charts—now supporting up to 14 advanced chart styles.
Morning Report | Aethir secures a $260 million enterprise contract with Axe Compute; New Fire Technology acquires Avenir Group's trading team; Polymarket's trading volume surpassed by Kalshi

Why a Million-Follower Crypto KOL Chooses WEEX VIP?
Discover why top crypto KOL Carl Moon partnered with WEEX. Explore the WEEX VIP ecosystem, 1,000 BTC protection fund, and exclusive rewards for serious traders.
Tom Lee's Ethereum Thesis: Why the Man Who Called the Last Cycle Is Doubling Down on Bitmine
Tom Lee is emerging as one of Ethereum’s most influential supporters. From Fundstrat to Bitmine, his Ethereum thesis combines staking yield, treasury accumulation, and long-term network value. Here is why “Tom Lee Ethereum” has become one of crypto’s most watched narratives.
